7.9 KiB
Basic Usage: This document describes the basic usage of the pyecharts library.
Install pyecharts
Compatibility
pyecharts supports Python2.7+ and Ptyhon3.5+. If you are using Python 2.7, please declare the character encoding at the top of the code, otherwise there will be Chinese garbled problems.
#coding=utf-8
from __future__ import unicode_literals
pyecharts
pip install
$ pip install pyecharts
source code install
$ git clone https://github.com/pyecharts/pyecharts.git
$ cd pyecharts
$ pip install -r requirements.txt
$ python setup.py install
Map plugin
Since v0.3.2, in order to reduce the size of the project itself and maintain the lightweight operation of the pyecharts project, pyecharts will no longer have its own map js file. Developers who want to use the map must manually install the map plugin. Detailed reference Map Customization.
Quick start
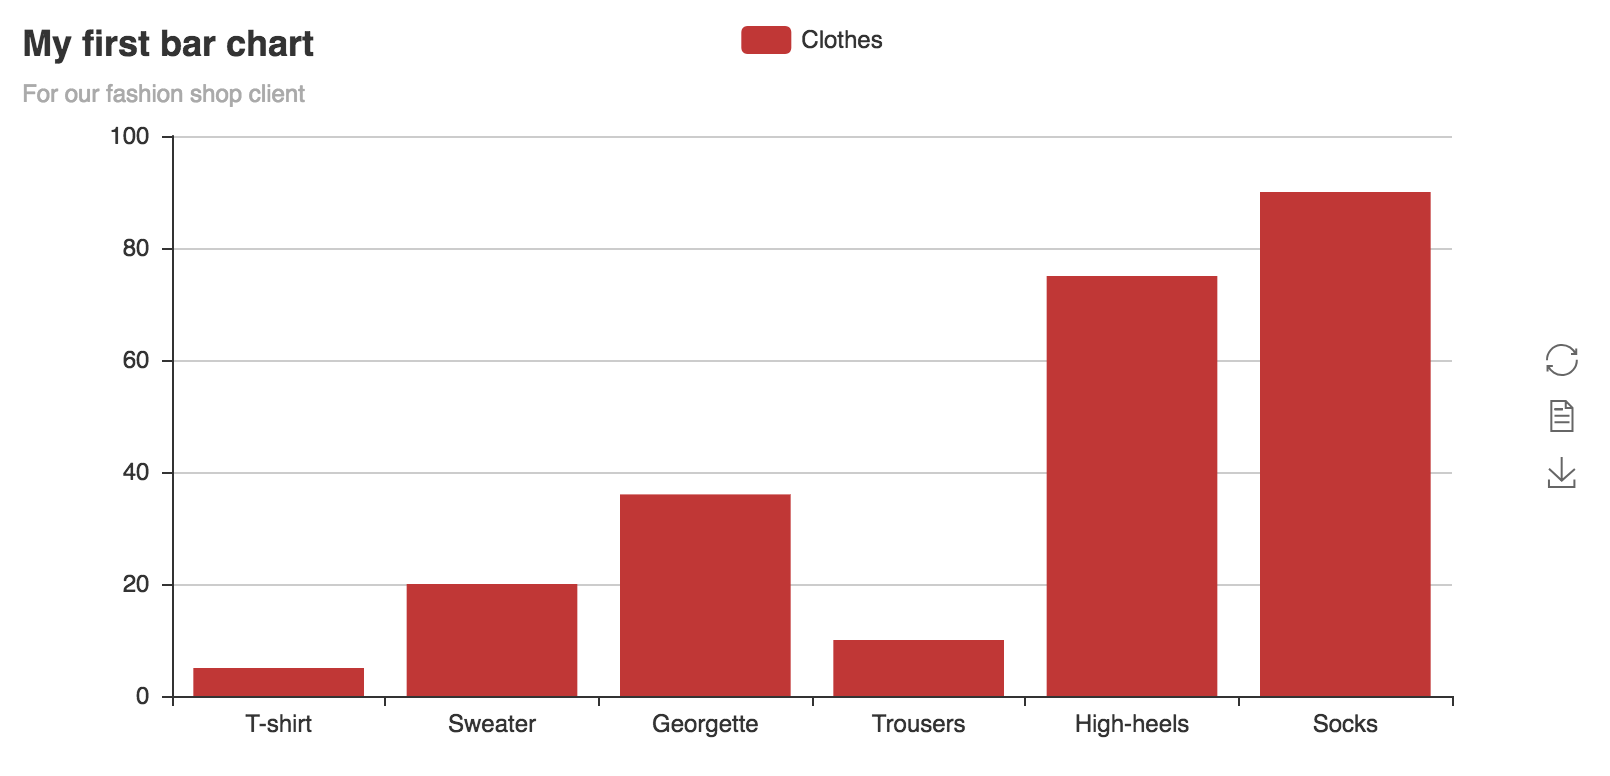
Now, you are ready to make your first chart!
from pyecharts import Bar

bar = Bar("My first bar chart", "For our fashion shop client")
bar.add("Clothes", ["T-shirt", "Sweater", "Georgette", "Trousers", "High-heels", "Socks"], [5, 20, 36, 10, 75, 90])
# bar.print_echarts_options() # This line is only for printing configuration items, which is convenient for debugging.
bar.render()  # generate a local HTML file
-
add()main method,add the data and set up various options of the chart -
print_echarts_config()print and output all options of the chart -
render()creat a file namedrender.htmlin the root directory defaultly, which supports path parameter and set the location the file save in, for instance render(r"e:\my_first_chart.html"), open file with your browser.
Note: Click the image download button on the right hand side of the chart. If you need more buttons, please insert is_more_utils=True when calling add()
from pyecharts import Bar

bar = Bar("My first bar chart", "For our fashion shop client")
bar.add("Clothes", ["T-shirt", "Sweater", "Georgette", "Trousers", "High-heels", "Socks"], [5, 20, 36, 10, 75, 90],
        is_more_utils=True)
bar.render()

Use theme
Since 0.5.2+, pyecharts has supported the replacement of the theme color. Here's an example of changing to 'dark':
from pyecharts import Bar

bar = Bar("My first bar chart", "For our fashion shop client")
bar.use_theme('dark')
bar.add("Clothes", ["T-shirt", "Sweater", "Georgette", "Trousers", "High-heels", "Socks"], [5, 20, 36, 10, 75, 90])
bar.render()
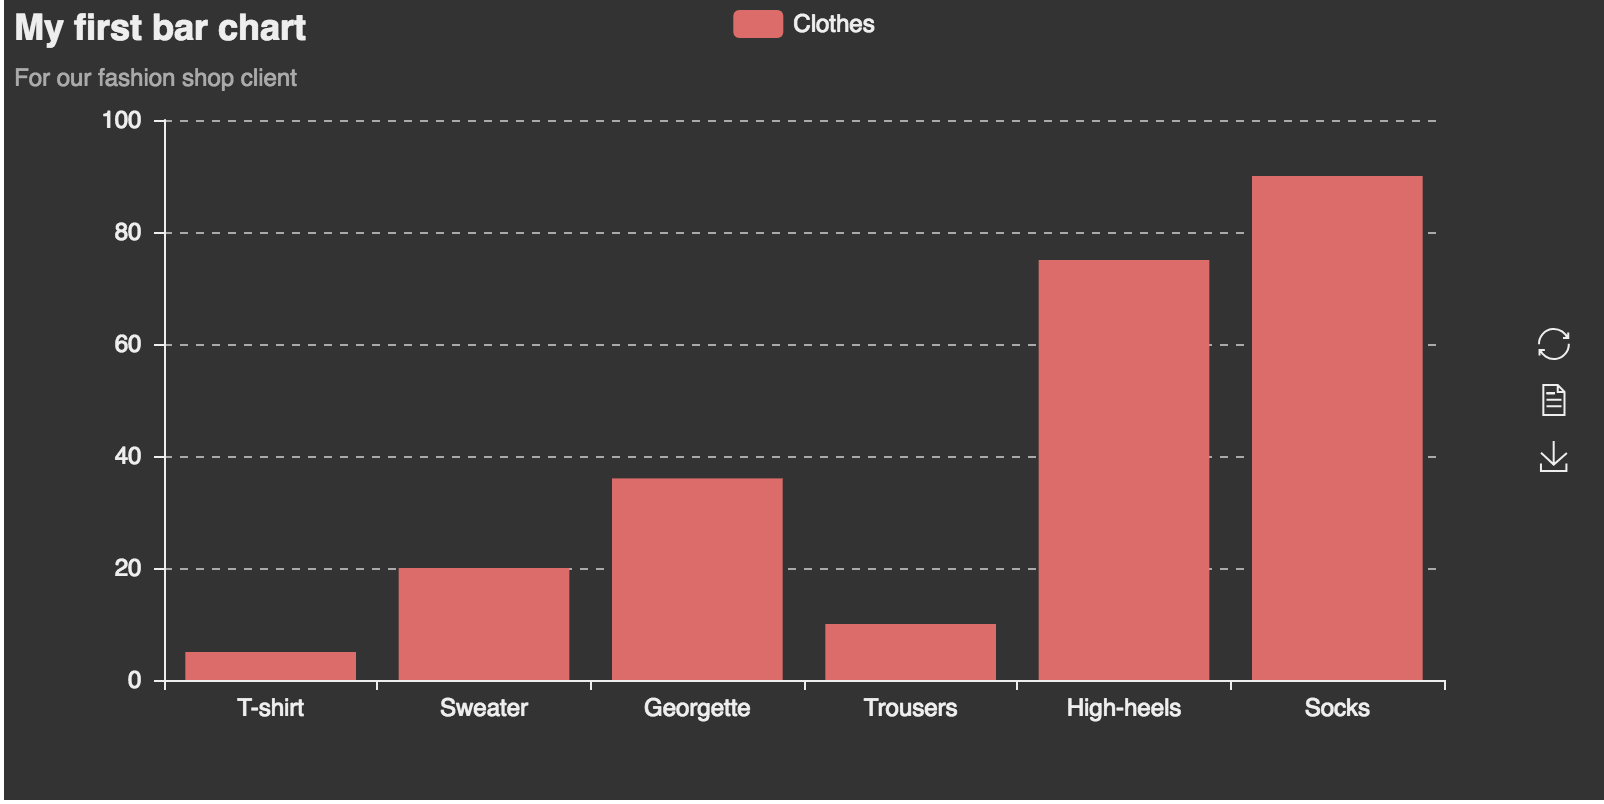
pyecharts supports extra 5 body colors, Please move to the theme color for more configuration information.
Rendering as image using pyecharts-snapshot
To get png, pdf, gif files instead of render.html, pyecharts-snapshot is required。What's more, node.js is also required and can be downloaded from https://nodejs.org/en/download/.
- Install phantomjs
npm install -g phantomjs-prebuilt - install pyecharts-snapshot
pip install pyecharts-snapshot - Call
rendermethod
bar.render(path='snapshot.png')
The file suffix can be svg/jpeg/png/pdf/gif. Note that the svg file requires you to setrenderer='svg'in the chart's constructor.
For more details, please refer to pyecharts-snapshot
Chart drawing process
A chart class provides the following apis for building and rendering. Here are the generic steps to draw your own chart:
| Step | Describe | Code example | Remarks |
|---|---|---|---|
| 1 | Instance a concrete object of chart | chart = FooChart() |
|
| 2 | Add a common configuration to the chart, such as a theme | chart.use_theme() |
|
| 3 | Add a specific configuration to the chart | geo.add_coordinate() |
|
| 4 | Add data and configuration items | chart.add() |
Refer to Data Analysis and Import |
| 5 | Generate local file(html/svg/jpeg/png/pdf/gif) | chart.render() |
From v0.5.9, the methods involved above support method-chaining. For example:
from pyecharts import Bar

CLOTHES = ["T-shirt", "Sweater", "Georgette", "Trousers", "High-heels", "Socks"]
clothes_v1 = [5, 20, 36, 10, 75, 90]
clothes_v2 = [10, 25, 8, 60, 20, 80]

(Bar("My second bar chart")
    .add("H&M", CLOTHES, clothes_v1, is_stack=True)
    .add("Zara", CLOTHES, clothes_v2, is_stack=True)
    .render())
Render Charts Many Times
From v0.4.0+, pyecharts reconstructed the internal logic of rendering to improve efficiency. It is recommended to display multiple charts in the following ways.
You can call chart.render many times to show some charts in a script.
from pyecharts import Bar, Line

bar = Bar("我的第一个图表", "这里是副标题")
bar.add("服装", ["衬衫", "羊毛衫", "雪纺衫", "裤子", "高跟鞋", "袜子"], [5, 20, 36, 10, 75, 90])
bar.render(path='bar.html')

line = Line("我的第一个图表", "这里是副标题")
line.add("服装", ["衬衫", "羊毛衫", "雪纺衫", "裤子", "高跟鞋", "袜子"], [5, 20, 36, 10, 75, 90])
line.render(path='line.html')
In v0.4.0+, pyecharts refactors the internal logic and make render faster.The following code is recommended.
from pyecharts import Bar, Line
from pyecharts.engine import create_default_environment

bar = Bar("我的第一个图表", "这里是副标题")
bar.add("服装", ["衬衫", "羊毛衫", "雪纺衫", "裤子", "高跟鞋", "袜子"], [5, 20, 36, 10, 75, 90])

line = Line("我的第一个图表", "这里是副标题")
line.add("服装", ["衬衫", "羊毛衫", "雪纺衫", "裤子", "高跟鞋", "袜子"], [5, 20, 36, 10, 75, 90])

env = create_default_environment()
# Create a default configuration environment for rendering
# create_default_environment(filet_ype)
# file_type: 'html', 'svg', 'png', 'jpeg', 'gif' or 'pdf'

env.render_chart_to_file(bar, path='bar.html')
env.render_chart_to_file(line, path='line.html')
This example uses the only one engine object to render multiple charts.
Pandas & Numpy examples
In the context of Numpy and/or Pandas, pdcast(pddata) and npcast(npdata) methods, provided in 0.19.2 are no log required. Please see the advanced example in README.

Note: When using Pandas&Numpy, ensure that the integer type is int instead of numpy.int32
Of course you can use the cooler way, use Jupyter Notebook to show the chart. What matplotlib have,so do pyecharts
Note: From v0.1.9.2, the render_notebook() method has been deprecated and is now more pythonic. It is ok to call the instance itself directly.
like this

and this

more Jupyter notebook examples, please refer to notebook-use-cases. You could download and run it on your notebook.
Use Jupyter Notebook to display charts, just call your own instance and be compatible with Python2 and Python3's Jupyter Notebook environment. All charts can be displayed normally, and the interactive experience is consistent with the browser. It is even no need PPT with this method to display report! !
Offline installation instructions for pyecharts
Please visit faq section for more details