* add support with google map(GMap)

* add support with leaflet map(LMap);

* fix blank

* add api in class Base for echarts stats extension

* support multiple calendar (#2414)

* support multiple calendar

* Fix PrettyTable class not expose parameters (#2416)

* Fix/grid and table (#2419)

fix grid chart_id not working and format table.py

* update version to 2.0.9

* fix: issue#2421 (#2422)

fix: issue#2421

* Fix grid index (#2426)

fix some bugs in Grid component

* 更新 MarkPointOpts、MarkPointItemOpts 以及 LabelOpts (#2427)

* update README.md

* [hotfix]fix page missing css_libs

* fix workflows

* fix workflows

* update engine.py

* FIX enable changing locale (#2442)

* FIX enable changing locale

* FIX add locale two more templates

* FIX add tests and defaultLocale

* FIX add tests and defaultLocale

* FIX add locale render in HTML test

---------

Co-authored-by: Feiko Ritsema <fritsema@netflix.com>

* update line.py and update workflows

* update python-app.yml

---------

Co-authored-by: sunhailin <sunhailin@jtexpress.com>
Co-authored-by: jiangyang <jiangyangcreate@gmail.com>
Co-authored-by: GokoRuri <1249736473@qq.com>
Co-authored-by: Feiko <feiko.ritsema@hotmail.com>
Co-authored-by: Feiko Ritsema <fritsema@netflix.com>

pyecharts
Python ❤️ ECharts = pyecharts
![]()
![]()
![]()


![]()
![]()
📣 Introduction
Apache ECharts is easy-to-use, highly interactive and highly performant javascript visualization library under Apache license. Since its first public release in 2013, it now dominates over 74% of Chinese web front-end market. Yet Python is an expressive language and is loved by data science community. Combining the strength of both technologies, pyecharts is born.
✨ Feature highlights
- Simple API, Sleek and method chaining
- Support 30 + popular charts
- Support data science tools: Jupyter Notebook, JupyterLab, nteract, marimo
- Integrate with Flask,Django at ease
- Easy to use and highly configurable
- Detailed documentation and examples.
- More than 400+ geomaps assets for geograpic information processing
⏳ Version
v0.5.x is not compatible with V1, which is a completely new version, see ISSUE#892, ISSUE#1033. pyecharts/issues/1033).
V0.5.x
Support for Python 2.7, 3.4+
At the discretion of the development team, version 0.5.x will no longer be maintained. Version 0.5.x code is located in the 05x branch and documentation is located at 05x-docs.pyecharts.org.
V1
Python 3.7+ only
The new version series will start with v1.0.0, documented at pyecharts.org; examples at gallery.pyecharts.org
V2
Python 3.7+ only
The new version is based on Echarts 5.4.1+ for rendering, and the documentation and examples are in the same location as V1.
🔰 Installation
pip install
$ pip install pyecharts
Install from source
$ git clone https://github.com/pyecharts/pyecharts.git
$ cd pyecharts
$ pip install -r requirements.txt
$ python setup.py install
📝 Usage
Local computer
HTML
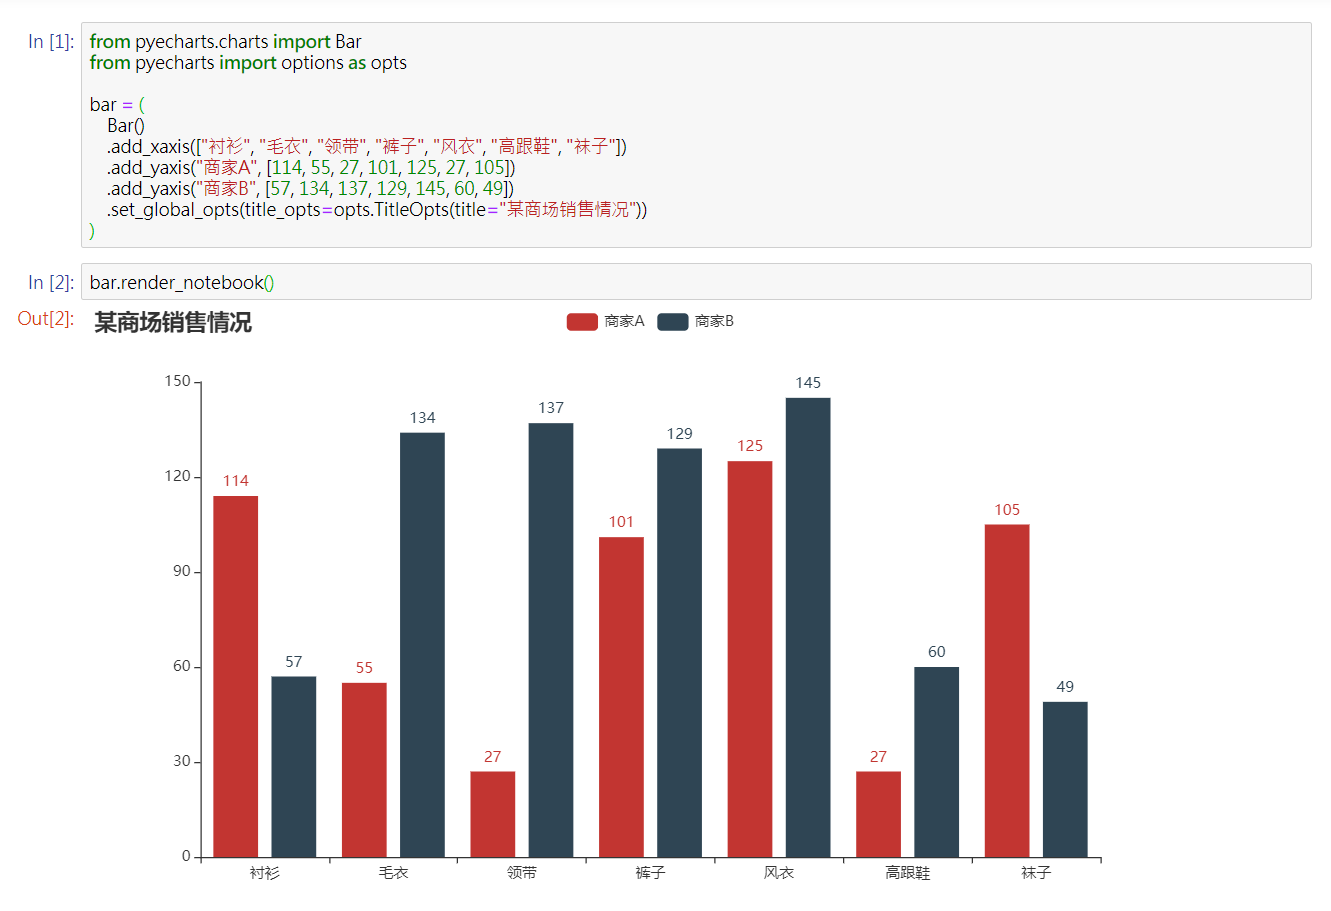
from pyecharts.charts import Bar
from pyecharts import options as opts

bar = (
    Bar()
    .add_xaxis(["衬衫", "毛衣", "领带", "裤子", "风衣", "高跟鞋", "袜子"])
    .add_yaxis("商家A", [114, 55, 27, 101, 125, 27, 105])
    .add_yaxis("商家B", [57, 134, 137, 129, 145, 60, 49])
    .set_global_opts(title_opts=opts.TitleOpts(title="某商场销售情况"))
)
bar.render()

image
from pyecharts.render import make_snapshot

# needs to configure selenium
make_snapshot(bar.render(), "bar.png")

Notebook
Jupyter Notebook
JupyterLab

Web framework

🔖 Demo


For more documentation, please visit
⛏ Software development
Unit tests
$ pip install -r test/requirements.txt
$ make
Team development
Travis CI and AppVeyor is place for continuous integration.
Coding styles
flake8, Codecov and pylint are used
😉 Author
pyecharts are co-maintained by:
For more contributors, please visit pyecharts/graphs/contributors
💌 Donation
To develop and maintain pyecharts, it took me a lot of overnights. If you think pyecharts has helped you, please consider buying me a coffee:


Please also buy the other maintainer a coffee if you think their work helped you too donation details
📃 License
MIT ©chenjiandongx