* 1. update en-us docs translation work;
2. en-us docs faq.md and flask.md need to fininsh later

* Complete the en_us synchronization with zh_cn on current phase
9.5 KiB
Advanced Usage: This document describes advanced usage of the pyecharts library.
Overview
Starting with v0.5.0, pyecharts supports the javascript callback function and the echarts event handler, further covering the ECharts related features. Inject new vitality into the development of the project.
In the field of Python-To-Javascript language translation, javascripthon is a simple Python 3.5+ to Javascript language translator; [dukpy](https:/ /github.com/amol-/dukpy) Supports language translation for Python 2.7 and Python 3.4.
Based above, the pyecharts team developed [pyecharts-javascripthon] (https://github.com/pyecharts/pyecharts-javascripthon) as the underlying Python-To-Javascript language translation library, which encapsulated the above two different translators. Several Javascript data type adaptation modules are also available. For more on the translator, please go to [Translator] (en-us/translator).
pyecharts currently only uses and encapsulates some of Javascripthon's translation rules, mainly Function Translate. Use pseudo code to indicate the following:
input:a Python function objection
output:a multi-line unicode string
For example, input the following Python functions:
def add(x, y):
    return x + y
Translated into the following Javascript functions.
function add(x, y) {
    return (x + y);
}
For pyecharts users, there is no need to understand how the translator works.
Installation
Basic installation
pyecharts has pyecharts-javascripthon installed by default and can also be installed via pip.
$ pip install pyecharts-javascripthon
Environment restrictions
Since Javascripthon requires a version of Python of at least 3.5+ and pyecharts users of python 2.7, 3.4, 3.5 and 3.6, pyecharts-javascripthon uses a two-track system: python 3.5+ users directly use Javascripthon; python 2.7 and 3.4 users call network translation services (software as a service). At the same time, I hope that everyone will support the operating expenses of this network service.
Note: Make sure the system is networked when using Python 2.7-3.4 users.
JavaScript callback function
Basic usage
pyecharts has encapsulated the underlying related logic and is transparent to the user. So you can use it as before. The callback function is assigned to the echarts configuration dictionary via the add method. The callback function here must satisfy one of the following conditions:
- Defined function with
def
Note that the lambda expression is currently not supported.
Example:
from pyecharts import Bar


def label_formatter(params):
    return params.value + ' [Good!]'


attr = ["Jan", "Feb"]
v1 = [2.0, 4.9]
bar = Bar("Bar chart", "precipitation and evaporation one year")
bar.add("precipitation", attr, v1, is_label_show=True, label_formatter=label_formatter)
bar.render()
Callback function format reference series[i]-bar.label.formatter 。
Rendering

Tooltip example
For example, pyecharts users often ask questions in the Geo diagram how to display only the map coordinate names and values in the tooltip without the latitude and longitude.
Like this:
def test_geo_shantou_city():
    data = [('澄海区', 30), ('南澳县', 40), ('龙湖区', 50), ('金平区', 60)]
    geo = Geo("汕头市地图示例", **style.init_style)
    attr, value = geo.cast(data)
    geo.add(
        "",
        attr,
        value,
        maptype="汕头",
        is_visualmap=True,
        is_legend_show=False,
        label_emphasis_textsize=15,
        label_emphasis_pos='right',
    )
    geo.render()

Now, you can do this by defining a geo_formatter function firstly.
def geo_formatter(params):
    return params.name + ' : ' + params.value[2]

def test_geo_shantou_city():
    data = [('澄海区', 30), ('南澳县', 40), ('龙湖区', 50), ('金平区', 60)]
    geo = Geo("汕头市地图示例", **style.init_style)
    attr, value = geo.cast(data)
    geo.add(
        "",
        attr,
        value,
        maptype="汕头",
        is_visualmap=True,
        is_legend_show=False,
        tooltip_formatter=geo_formatter,    # The point is here to pass the function directly as a parameter.
        label_emphasis_textsize=15,
        label_emphasis_pos='right',
    )
    geo.render()

Label example
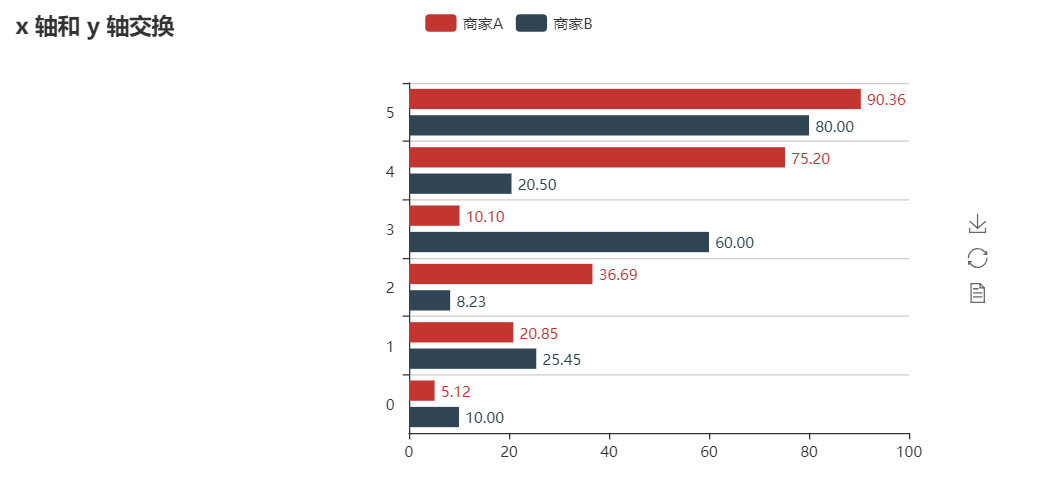
Use the callback function to set float type
from pyecharts_javascripthon.dom import window
from pyecharts import Bar, Grid


def custom_formatter(params):
    return window.parseFloat(params.value).toFixed(2)


attr = ["aa", "bb", "Diabetes Mellitus Requiring Medication", "d", "e", "fff"]
v1 = [5.12, 20.85, 36.69, 10.10, 75.20, 90.36]
v2 = [10.00, 25.45, 8.23, 60.00, 20.50, 80.00]
bar = Bar("x 轴和 y 轴交换")
bar.add(
    "商家A",
    attr,
    v1,
    is_label_show=True,
    label_pos="right",
    label_formatter=custom_formatter,
)
bar.add(
    "商家B",
    attr,
    v2,
    is_convert=True,
    is_label_show=True,
    label_pos="right",
    label_formatter=custom_formatter,
)
grid = Grid()
grid.add(bar, grid_left="40%")
grid.render()
JavaScript event handlers
Echarts provides api/events event handlers, mainly via 'on' method.
pyecharts provides the following global event name variables based on the official list of events. Located in the pyecharts.echarts.events module.
# Mouse Events
MOUSE_CLICK = "click"
MOUSE_DBCLICK = "dbclick"
MOUSE_DOWN = "mousedown"
MOUSE_OVER = "mouseover"
MOUSE_GLOBALOUT = "globalout"

# Other Events
LEGEND_SELECT_CHANGED = "legendselectchanged"
LEGEND_SELECTED = "legendselected"
LEGEND_UNSELECTAED = "legendunselected"
LEGEND_SCROLL = "legendscroll"
DATA_ZOOM = "datazoom"
DATA_RANGE_SELECTED = "datarangeselected"
TIMELINE_CHANGED = "timelinechanged"
TIMELINE_PLAY_CHANGED = "timelineplaychanged"
RESTORE = "restore"
DATA_VIEW_CHANGED = "dataviewchanged"
MAGIC_TYPE_CHANGED = "magictypechanged"
GEO_SELECT_CHANGED = "geoselectchanged"
GEO_SELECTED = "geoselected"
GEO_UNSELECTED = "geounselected"
PIE_SELECT_CHANGED = "pieselectchanged"
PIE_SELECTED = "pieselected"
PIE_UNSELECTED = "pieunselected"
MAP_SELECT_CHANGED = "mapselectchanged"
MAP_SELECTED = "mapselected"
MAP_UNSELECTED = "mapunselected"
AXIS_AREA_SELECTED = "axisareaselected"
FOCUS_NODE_ADJACENCY = "focusnodeadjacency"
UNFOCUS_NODE_ADJACENCY = "unfocusnodeadjacency"
BRUSH = "brush"
BRUSH_SELECTED = "brushselected"
The usage is as follows:
#!/usr/bin/env python
# coding=utf-8
from __future__ import unicode_literals

import pyecharts.echarts.events as events
from pyecharts import Bar
from pyecharts_javascripthon.dom import alert


def on_click():
    alert("点击事件触发")


def test_mouse_click():
    bar = Bar("我的第一个图表", "这里是副标题")
    bar.add(
        "服装", ["衬衫", "羊毛衫", "雪纺衫", "裤子", "高跟鞋", "袜子"], [5, 20, 36, 10, 75, 90]
    )
    bar.on(events.MOUSE_CLICK, on_click)
    bar.render()
Note
First, pyecharts does not check if the echarts chart configuration option supports callback functions. See the ECharts documentation for this section.
This refers to whether the options parameter itself supports callback functions, such as :
def my_title():
    return 'my_title'
bar.add(my_title, [], [])
There are no rendering errors in pyecharts, but it does not meet the requirements for title in ECharts.
Second, in order to improve performance, pyecharts did the following:
- The actual execution of a function translation is when the
renderfunction is called, not theaddfunction. - Cache the function that has been translated with the function name as an index to avoid rendering the function of the same name multiple times.
Therefore, you should avoid using the same function name. The following situations may not achieve the expected results.
from pyecharts import Bar

def label_formatter(params):
    return params.name + ' [Good!]'

attr = ["Jan", "Feb"]
v1 = [2.0, 4.9]
bar = Bar("Bar chart", "precipitation and evaporation one year")
bar.add("precipitation", attr, v1, is_label_show=True, label_formatter=label_formatter)
bar.render()

def label_formatter(params):
    return params.name + '[OK!]'

bar2 = Bar("Bar chart", "precipitation and evaporation one year")
bar2.add("precipitation", attr, v1, is_label_show=True, label_formatter=label_formatter)
bar2.render()
Eidt _option
Developers can insert their own configuration options if the of pyecharts options cannot meet the requirements. The only problem is that pyecharts can't set an option to null. But from 0.5.10, this problem is solved.
from pyecharts import NULL, Kline

kline = Kline("K 线图-默认示例")
kline.add("日K", DATE, data)
kline._option['series'][0]['itemStyle']['normal']['borderColor'] = NULL
kline.render()