* checkpoint vitepress docs

* edits

* edits

* hero drop shadow

* d3-array edits

* resolve d3

* split d3-array

* move d3-array stuff around

* d3-array is collapsed: true

* italicize parameter names

* searching edits

* update dependencies

* d3-array edits

* array edits

* array edits

* array edits

* array edits

* array edits

* move files

* array edits

* array edits

* array edits

* getting started edits

* modules page

* array edits

* more structure

* live example

* dsv edits

* fetch edits

* dsv edits

* random edits

* time format edits

* time edits

* time edits

* modules edits

* color edits

* color edits

* interpolate edits

* scale-chromatic edits

* selection edits

* break up d3-interpolate

* scale edits

* time scale edits

* scale edits

* scale edits

* band edits

* band edits

* more descriptive titles

* band and point edits

* sequential edits

* diverging edits

* quantize edits

* quantile edits

* threshold edits

* doc edits

* fix titles

* sequential edits

* axis edits

* axis edits

* axis edits

* shape edits

* shape edits

* dark mode chart

* dark mode chart

* curve edits

* interpolate edits

* line edits

* link edits

* radial edits

* pie edits

* symbol edits

* stack edits

* stack examples

* path edits

* polygon edits

* quadtree edits

* random examples

* ease edits

* ease edits

* ease edits

* timer edits

* delaunay edits

* quadtree find example

* voronoi edits

* dispatch edits

* contour edits

* chord edits

* chord edits

* fix find highlight

* quadtree animation

* transition edits

* transition edits

* transition edits

* zoom edits

* drag edits

* brush edits

* force edits

* voronoi neighbors example

* hierarchy edits

* api edits

* community edits

* getting started edits

* geo edits

* Add short "D3 in React" section (#3659)

* Add short "D3 in React" section

I know you removed the TODO but I was already trying to fill it in! I think just making the distinction of modules that touch the DOM and those that don't was super clarifying for me personally when I figured that out. And I always forget the most basic ref pattern (and still might've messed it up here). I don't think we should get into updating or interactivity or whatever, but I think just this much goes a long way toward demystifying (and showing just the most basic best practices).

* forgot i made data generic, rm reference to normal distribution

* useEffect cleans up after itself

Co-authored-by: Mike Bostock <mbostock@gmail.com>

* Update getting-started.md

---------

Co-authored-by: Mike Bostock <mbostock@gmail.com>

* build fixes

* index edits

---------

Co-authored-by: Toph Tucker <tophtucker@gmail.com>
2.4 KiB
d3-chord
Chord diagrams represent flow between a set of nodes in a graph, such as transition probabilities between finite states, or people moving between rooms in a house.
This flow is typically represented by a square matrix of size n×n, where n is the number of nodes in the graph. Each value matrix[i][j] represents the flow from the ith node to the jth node. (Each number matrix[i][j] must be nonnegative, though it can be zero if there is no flow from node i to node j.)
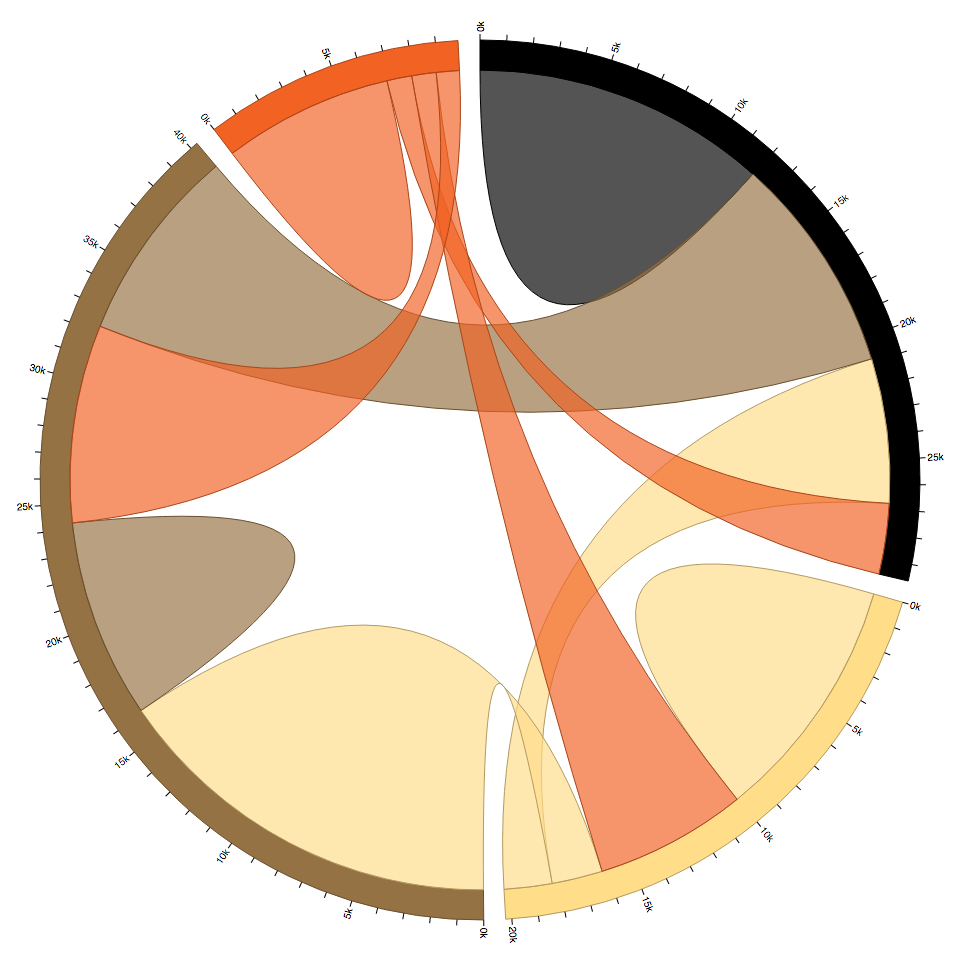
For example, here is a fake dataset from Circos which describes a population of people who dyed their hair. Each row and column represents a hair color (black, blond, brown, red); each value represents a number of people who dyed their hair from one color to another color. For example, 5,871 people had black hair and dyed it blond, while 1,951 people had blond hair and dyed it black. The matrix diagonal represents people who kept the same color.
const matrix = [
  // to black, blond, brown, red
  [11975,  5871, 8916, 2868], // from black
  [ 1951, 10048, 2060, 6171], // from blond
  [ 8010, 16145, 8090, 8045], // from brown
  [ 1013,   990,  940, 6907]  // from red
];
We can visualize these color transitions by arranging the population by starting color along the circumference of a circle and drawing ribbons between each color. The starting and ending width of the ribbon is proportional to the number of people that had the respective starting and ending color. The color of the ribbon, arbitrarily, is the color with the larger of the two values.
See one of: